LumiCloud/How to Use the Dashboard
LumiGuardian - How to Use the End User Portal Dashboard
Prerequisites
- LumiCloud User Account
- Devices added to LumiCloud
Video Guide
Steps
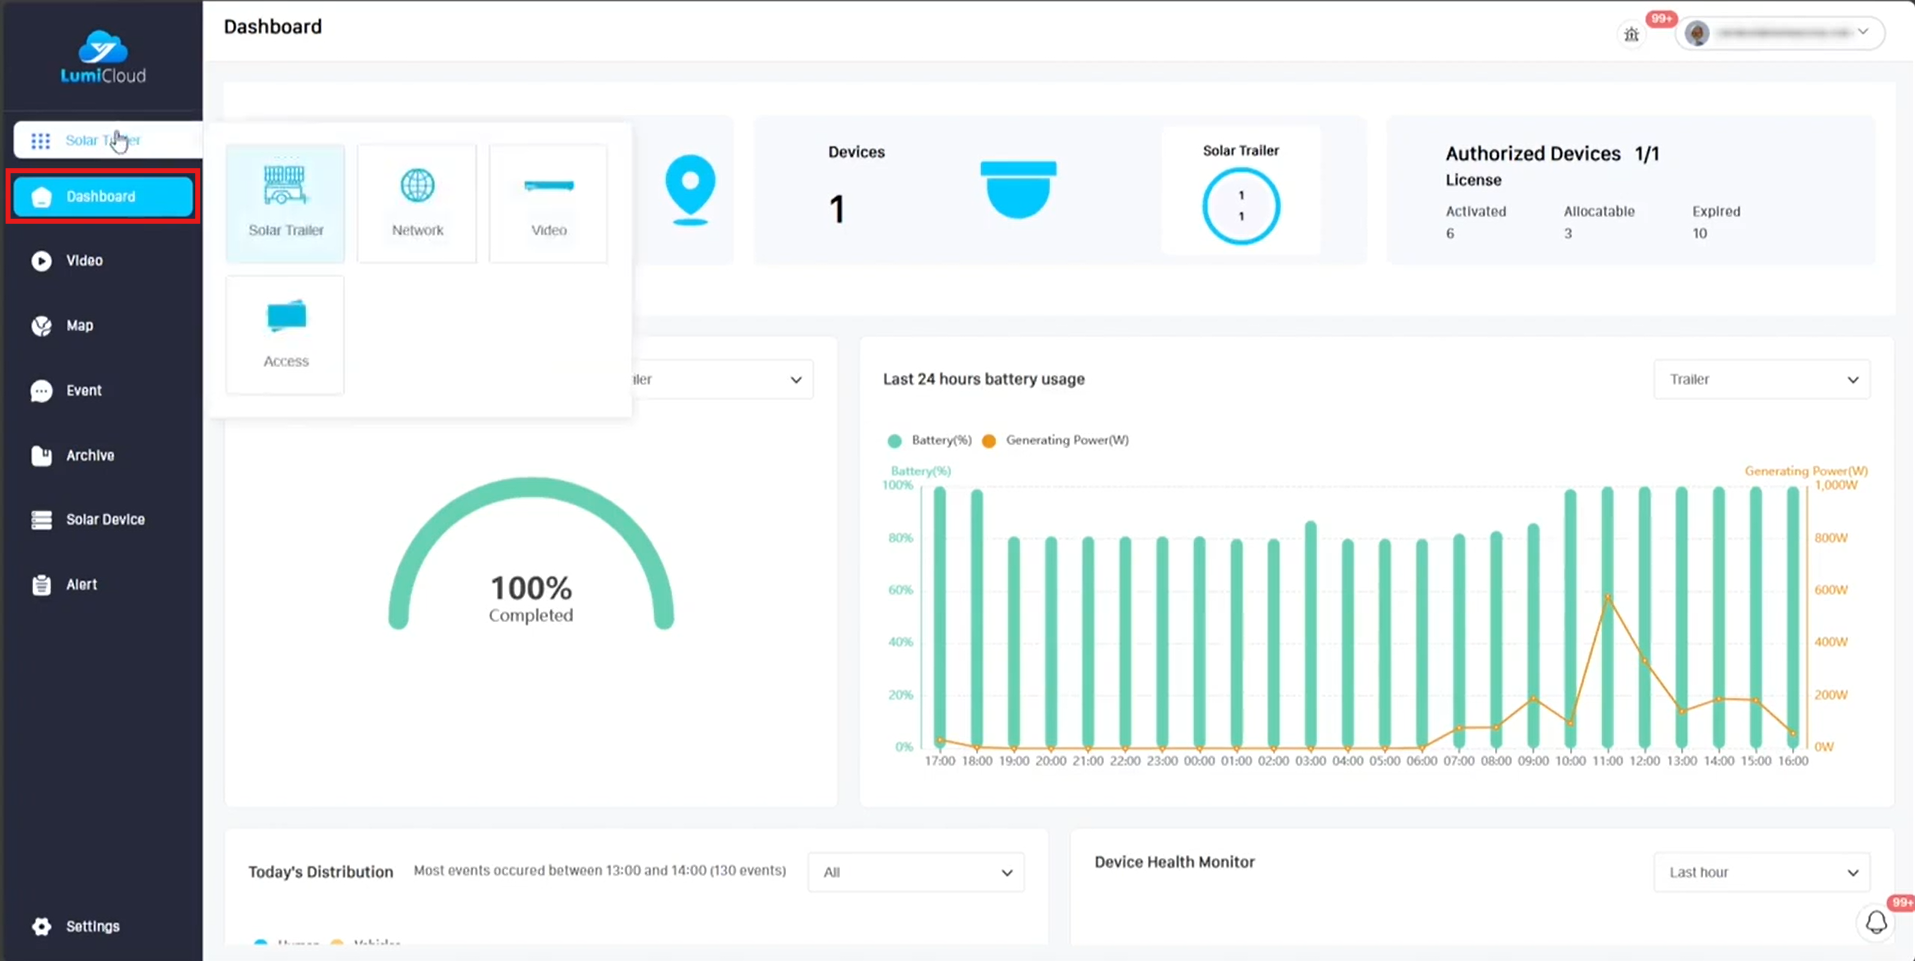
Today we will be learning how to use the Dashboard located in the End User Portal. The first step would be to log into your user portal, and then make sure you are selected on the dashboard option on the left. Also of note as you can see in the picture, you can switch between your device types and each device type has its own dashboard. For this demo we will be focusing on the Solar Trailer Dashboard.
For the next sections, I will break down what each section is used for.
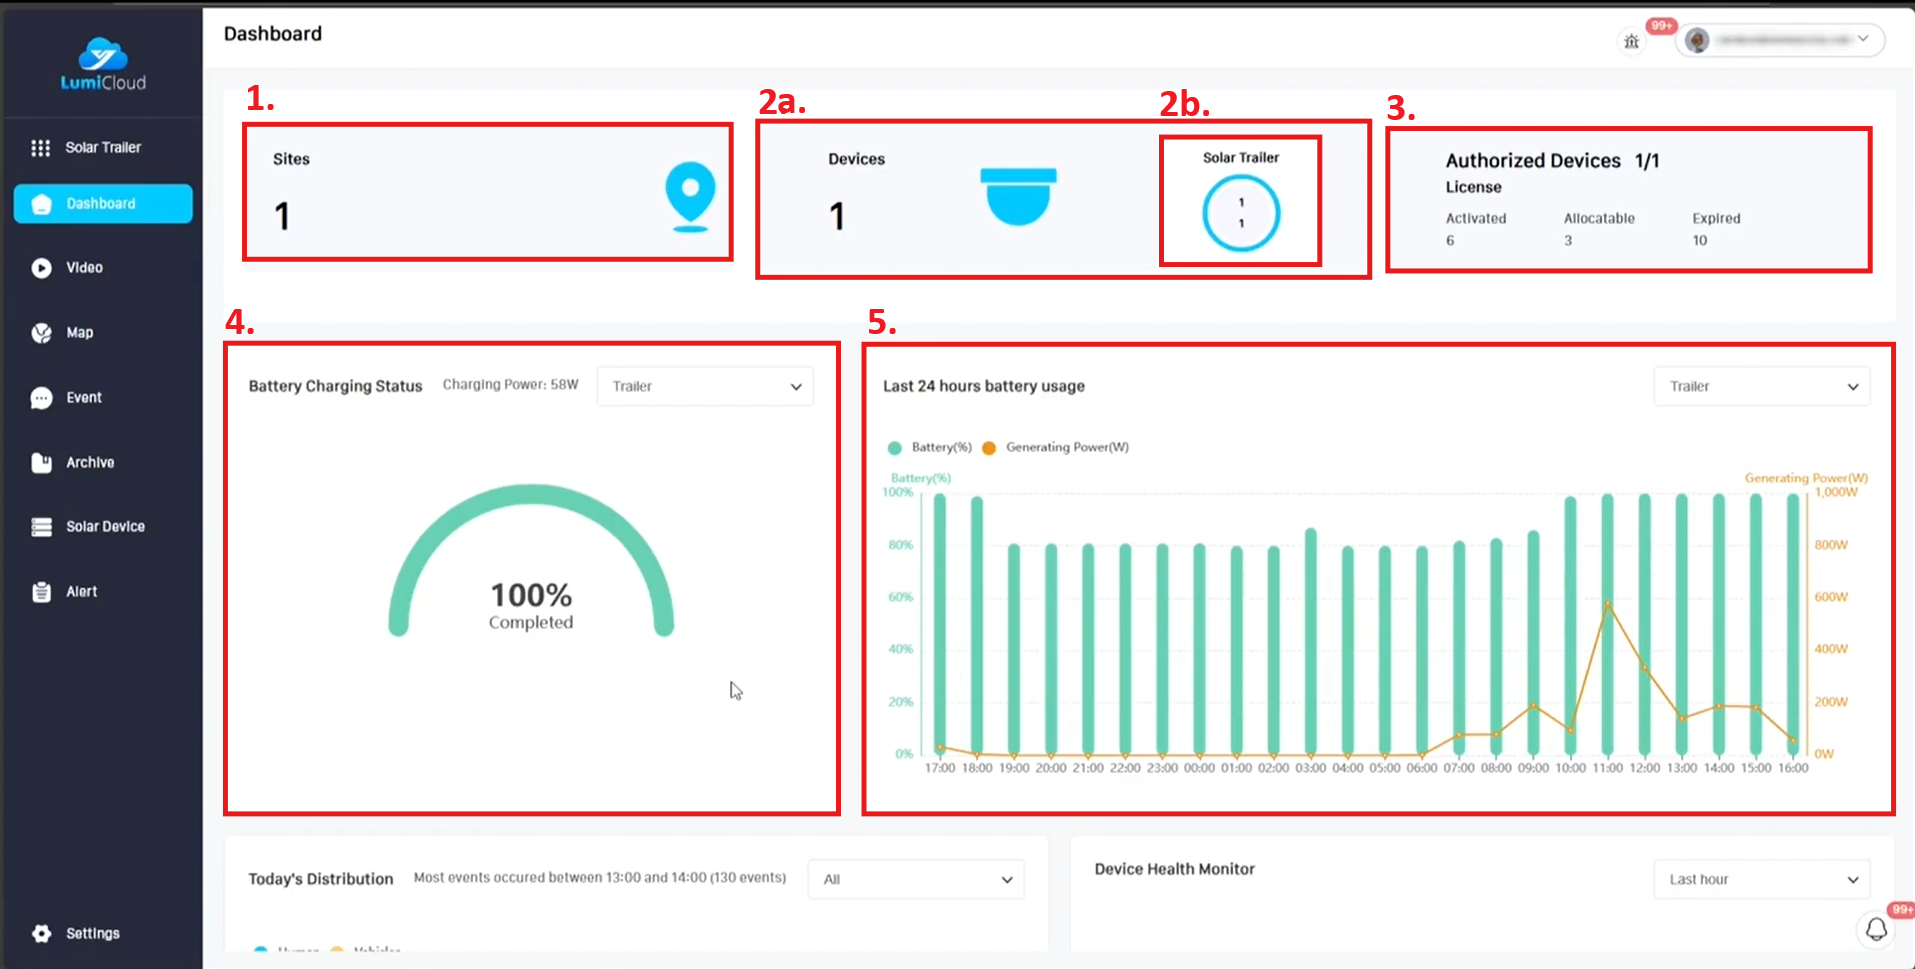
1. This section lists the total number of sites you have added into your LumiCloud (This would be the number of locations)
2a. The device box lists the total number of devices that have been added to the account.
2b. For this smaller box, the bottom number indicates the total number of devices on the account, and the top number indicates the total number of online devices.
3. This section covers your license information, the first part lists the number of authorized devices added. The “Activated” number indicates the number of licenses currently activated. “Allocatable” Indicates how many licenses are available to allocate. Then “Expired” indicates the total number of expired licenses.
4. This section covers the battery charge status like it indicates. You can use the drop down to change between the devices you have added to see their charge status. In the middle we can see that the current charge is 100% and then just above, you can see the charging power that is being provided from the solar panels.
5. This section covers the batter usage over the last 24 hours in graph form. The green bars indicate the battery percentage, and the yellow line indicates the generating power in watts. You can also click the drop down to change the device you are looking at.
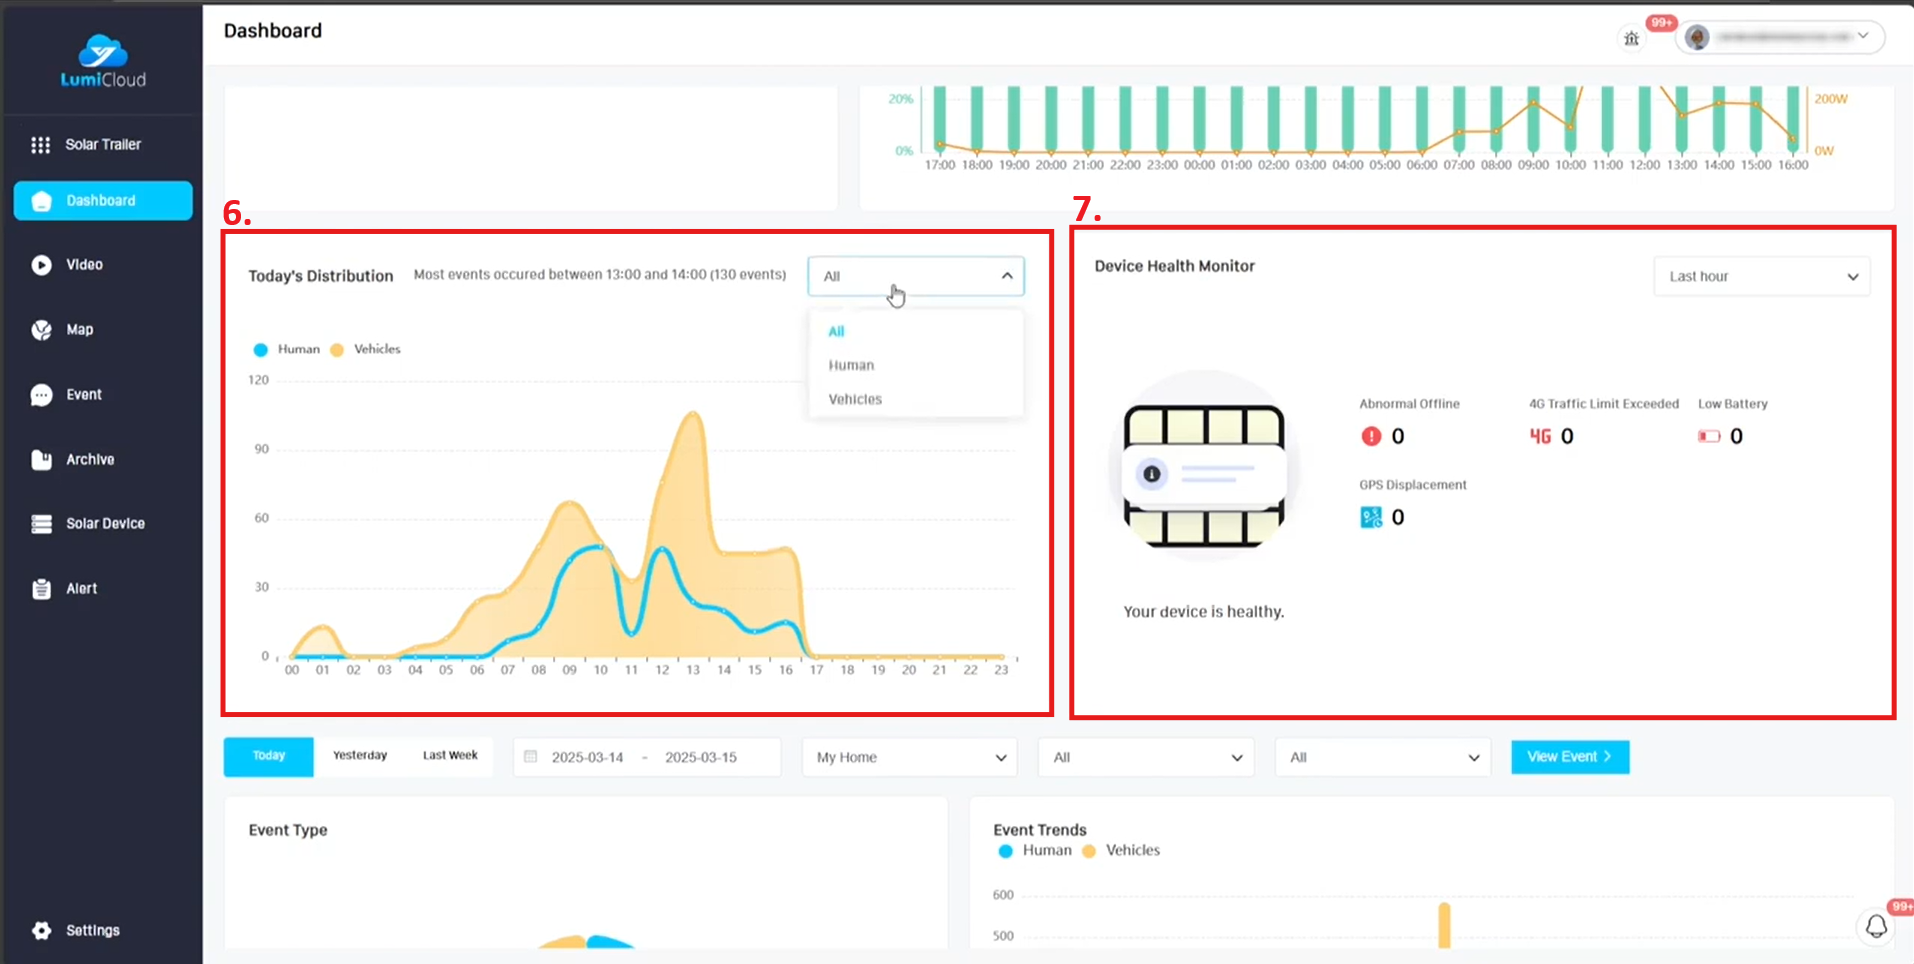
6. In this section titled “Today’s Distribution” it displays the human and vehicles detections in graph form that occurred today. You can also click the drop down to filter to human only, vehicle only or both.
7. In the section titled “Device Health Monitor”, this shows information about related to the health of different devices on the account. It will list healthy if there are no issues. It shows how many devices are abnormally offline, how many are reaching their 4G data limit, how many have a low battery percentage as well as how many devices have had their GPS locations moved. BY default it shows the last hour but you can change between last 24 hours, last 7 days and last 30 days from the drop down.
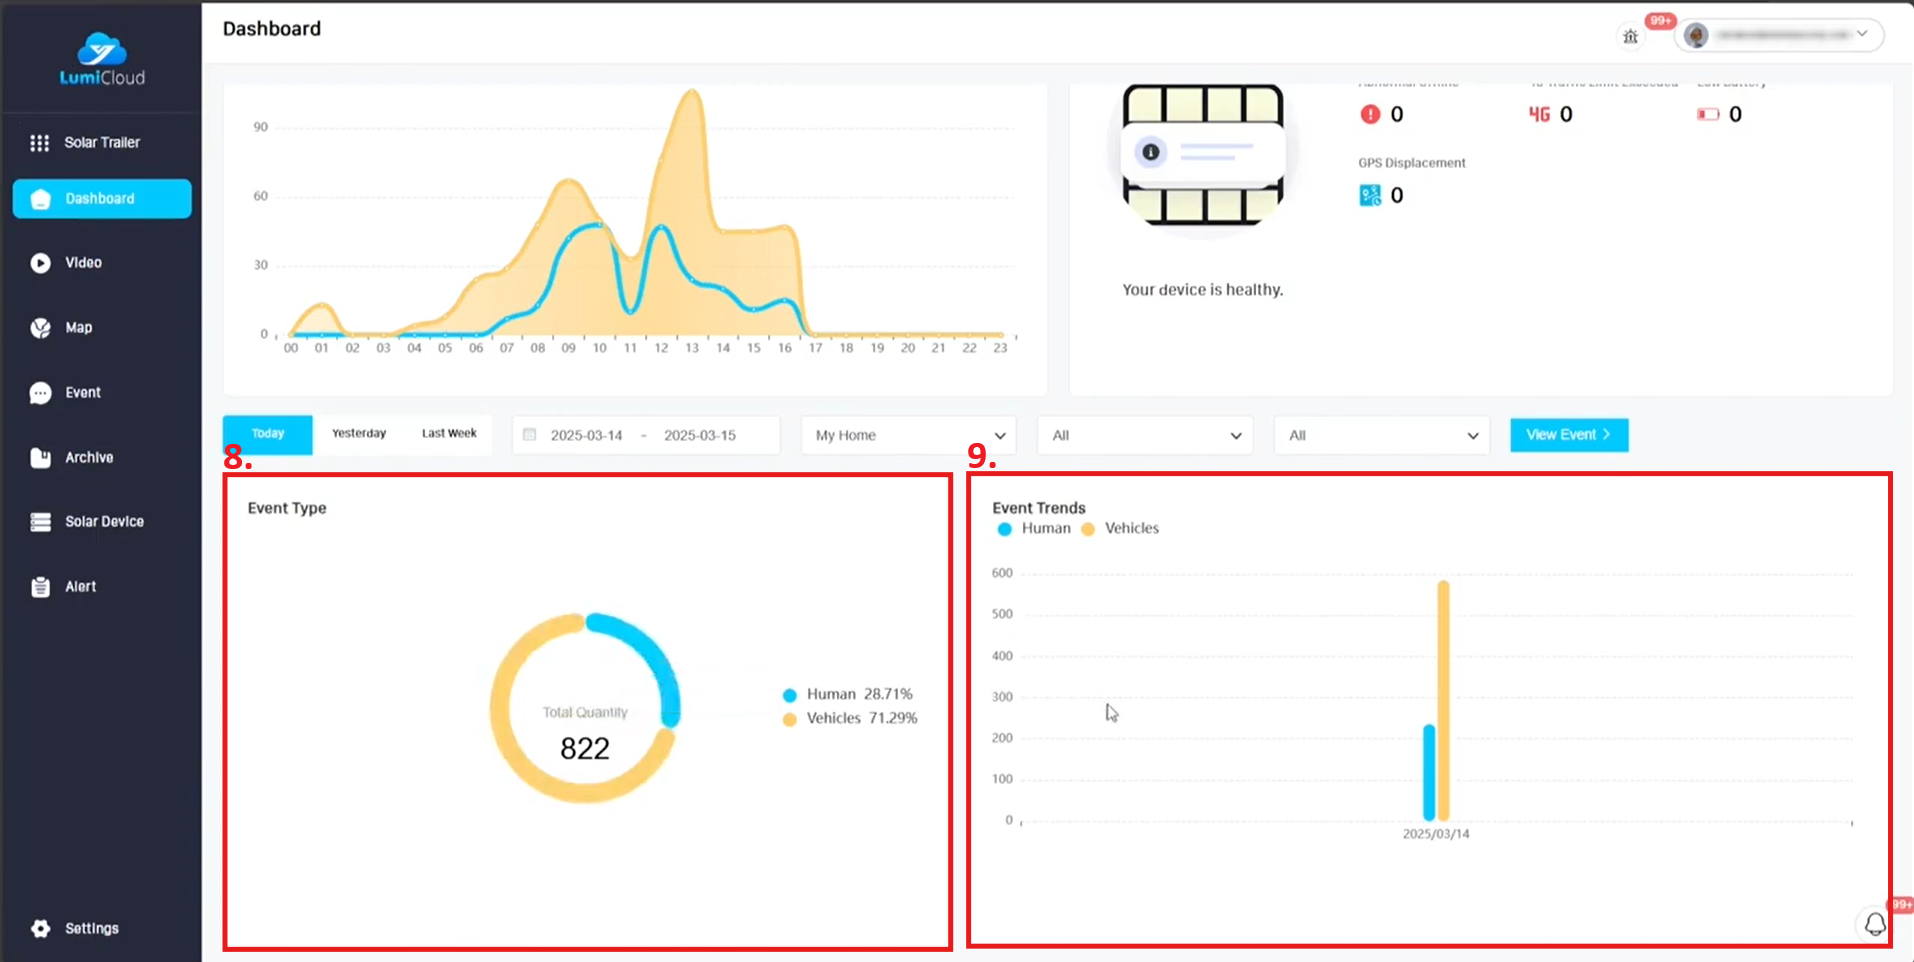
8. In this section you will see a circle graph related to event types showing the amount of humans and vehicles detected today.
9. In this section shows a bar graph related to the same information. You can also use the filter options above these graphs to switch between Today, Yesterday, Last week or you can specify the date you want using the calendar. You can also filter by site, device or event type.


